Get Visual to Get Through  

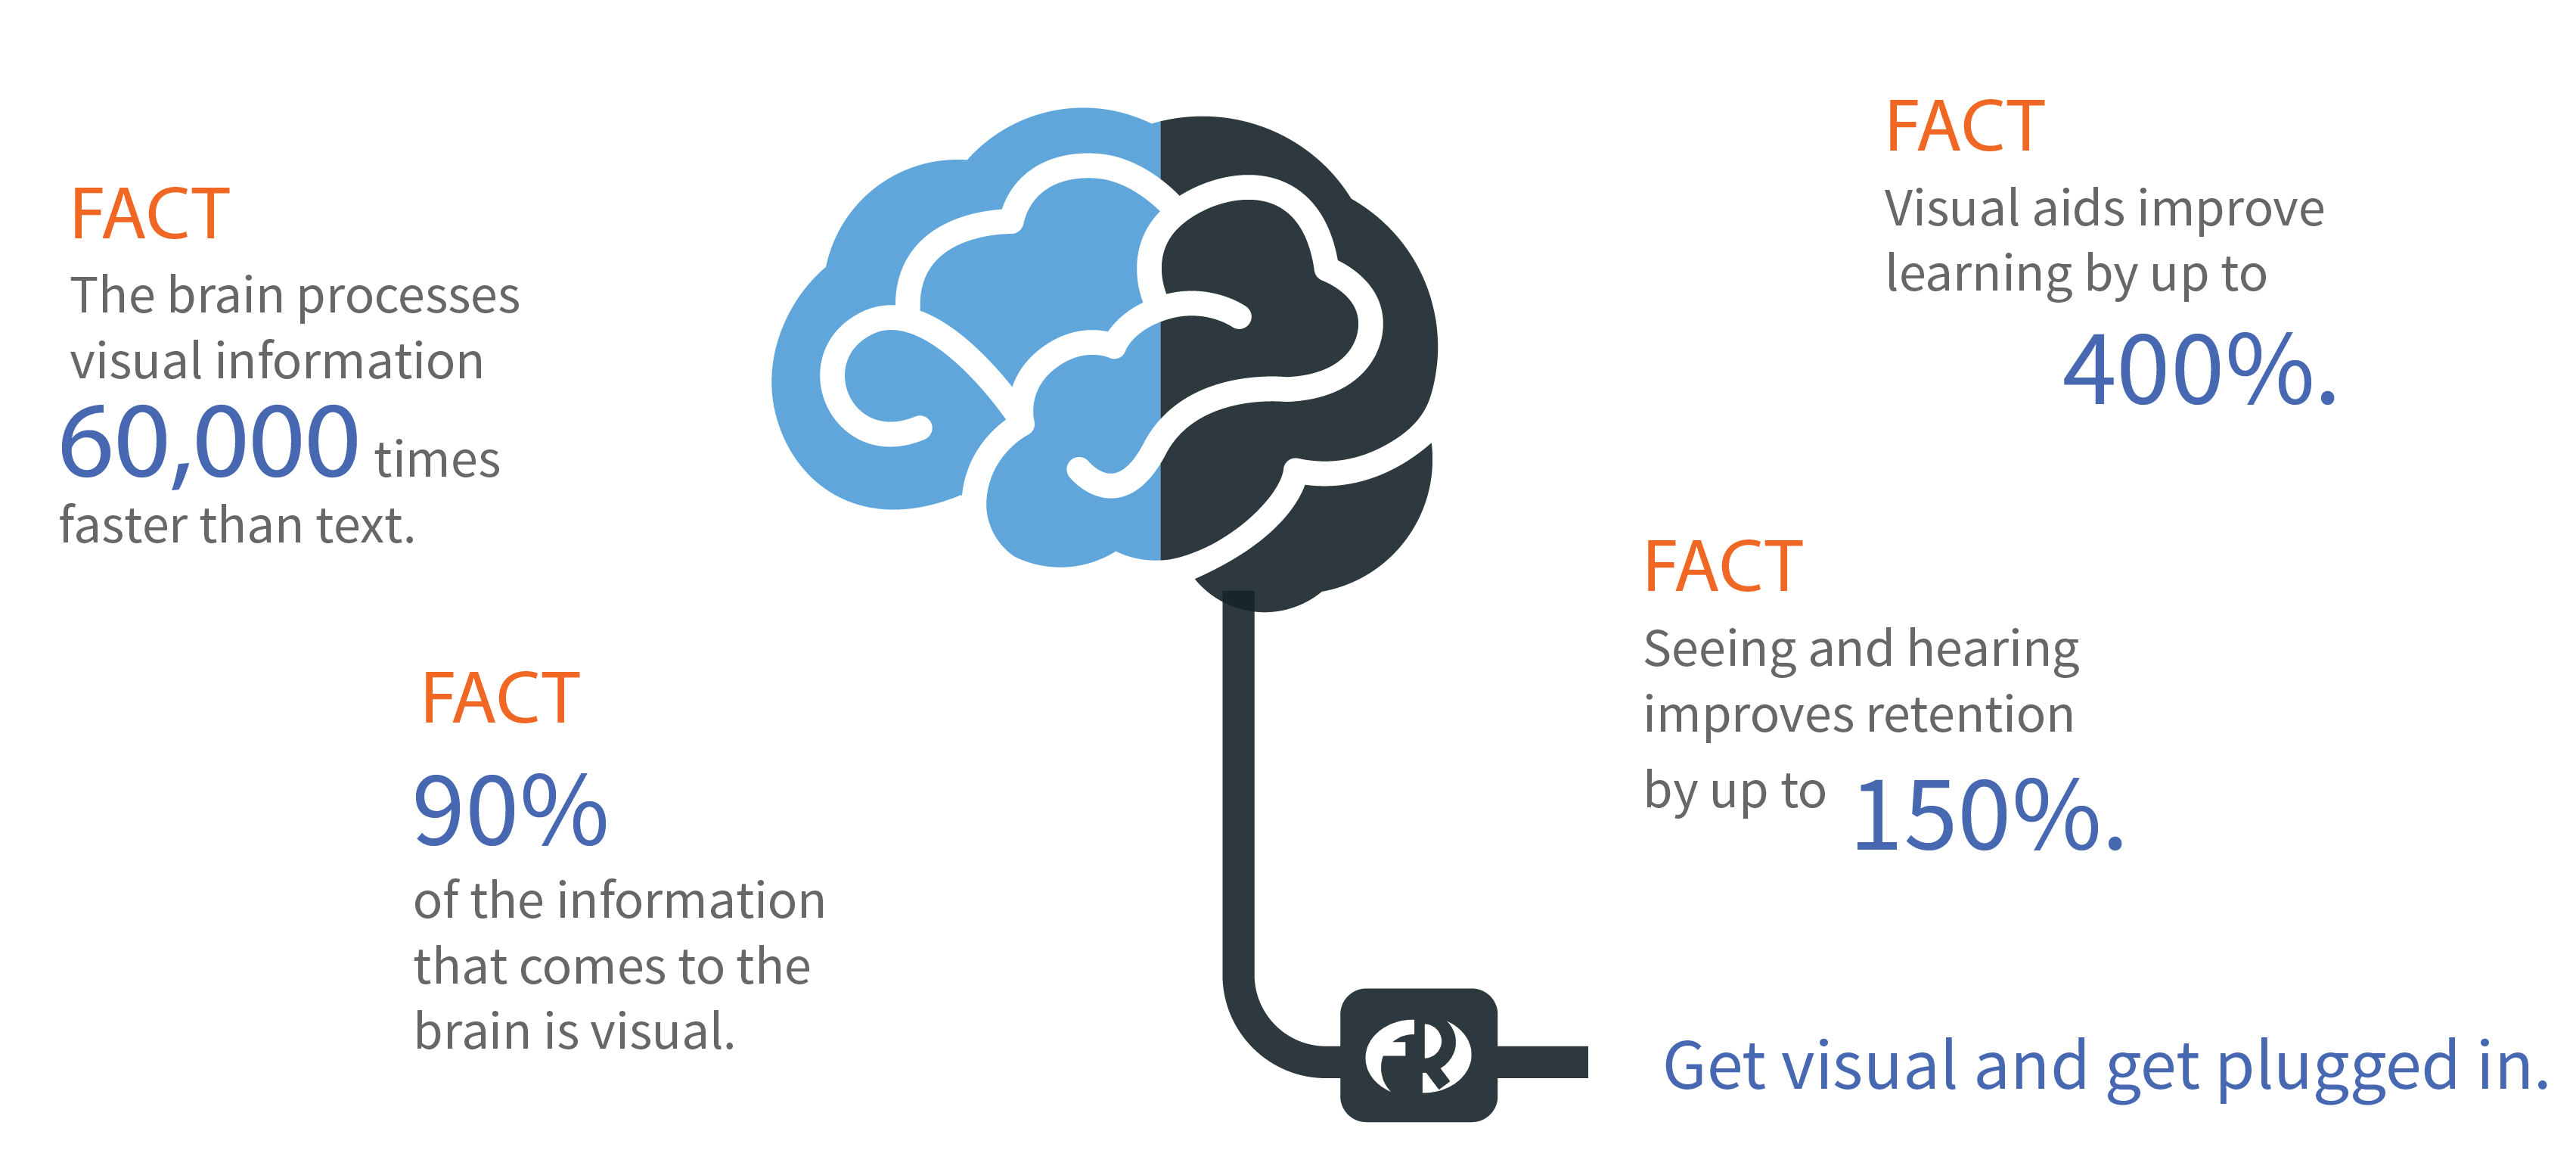
90% of the information our brains process is visual and we process that information faster and retain it longer.  So if you want to give a memorable presentation with messages that stick, you need to get visual.  We're talking photos, illustrations, models, infographics, charts, tables and video.  
services-infographic

We Can Make Your Data Talk

Today’s audiences want data and analytics. They need the information served fast and visually.  And, nothing conveys complex information more efficiently and effectively than graphics. Whether it’s a business model, a process, a technology, an opportunity, a competitive landscape, or a trend, graphics enable your audience to see the point. That’s important to you, because seeing and hearing together significantly increases understanding and retention. So, it shouldn’t come as a surprise that the quality of your graphics impacts the effectiveness of your communication. Who’s using them?  Just about everywhere you turn you see custom graphics being employed to drive home a point. 

If You’re Not Using Custom Graphics to
Tell Your Story, its Time to Evolve.

Say Goodby to Generic Visuals

Say Goodbye to Generic Visuals

Generic, clip art and unprofessional graphics fail where you
need them most - to show the unique value you want to
convey
Improve Understanding

Improve Understanding

Visualization of complex concepts, information and
processes improves learning
Get Attention

Get Their Attention

Strong graphics command attention, hold interest, and
differentiate
Increase Information

Increase Information Retention

Professional visuals make a powerful impression
Make Your Point

Make Your Point

Effective graphics can clearly and succinctly tell a
compelling story helping you engender buy-in
Build an Asset Library

Build Your Visual Asset Library

Custom graphics can be used and reused across your
stakeholder audiences to create common understanding

We Develop Custom

 Corporate Infographics
Business Model Graphics
Business Process Illustration
Technology Illustration
Data Visualization
Strategy Visualization
Competitive Landscape Infographics
Company Fact Sheets
Program Logos
Investor Day Banners and Signage
Brochures and Collateral

Our Work

Oct-2013-color-test
work-5resized
Twitterresize
Across business presentations, we see the ability to utilize data and information visualization effectively as a distinct competitive advantage. Good graphics' ability to bring about the "ah-ha" much faster and with a lot fewer words, makes them a no-brainer in presentations.

Insights from the Road 

Take your presentation 
 from good to great


We've put together a list with the essentials to giving a great presentation to help you stand out from the pack.
Take Your Presentation From Good To Great

Key considerations when
planning your investor day


Check out answers to the key questions we receive from companies hosting an investor day.
Investor Day Support

The surge in infographics in
Street communications


The use of infographics in investor communications has exploded. We discuss why and how to you’ll want to use them.
Surge of Infographics

Ready to Make Your Point?
Let’s Talk.

Request a consultation to discuss how we can help raise your
profile and gain mindshare for your messages.

Ready to Gain More Mindshare?