


Today’s audiences need information, they want it fast, and they want it visually which is why infographics and data visualizations are a key element in business presentations.
Researchers have found we interpret visual information faster and retain it better. Combining visual information with narrative significantly increases both understanding and retention.
That brings us to business presentations. Infographics and data visualization have always been part of the business presentation repertoire – pie and bar charts and tables are prime examples. Today, more complex and custom infographics are increasingly essential.
WHAT'S CHANGED?

1) The explosion in data and data analytics has given us more data-centric insight to convey
2) The information we have access to is more complex and layered
3) Audiences need help in digesting the onslaught of information
As a result, we are seeing more infographics and data visualization in communications to business audiences. And, everyone is employing them — from HR to Sales to Treasury.
If you are contemplating including more infographics in your business communications, and we recommend you do, here are five types to consider:
BUSINESS MODEL
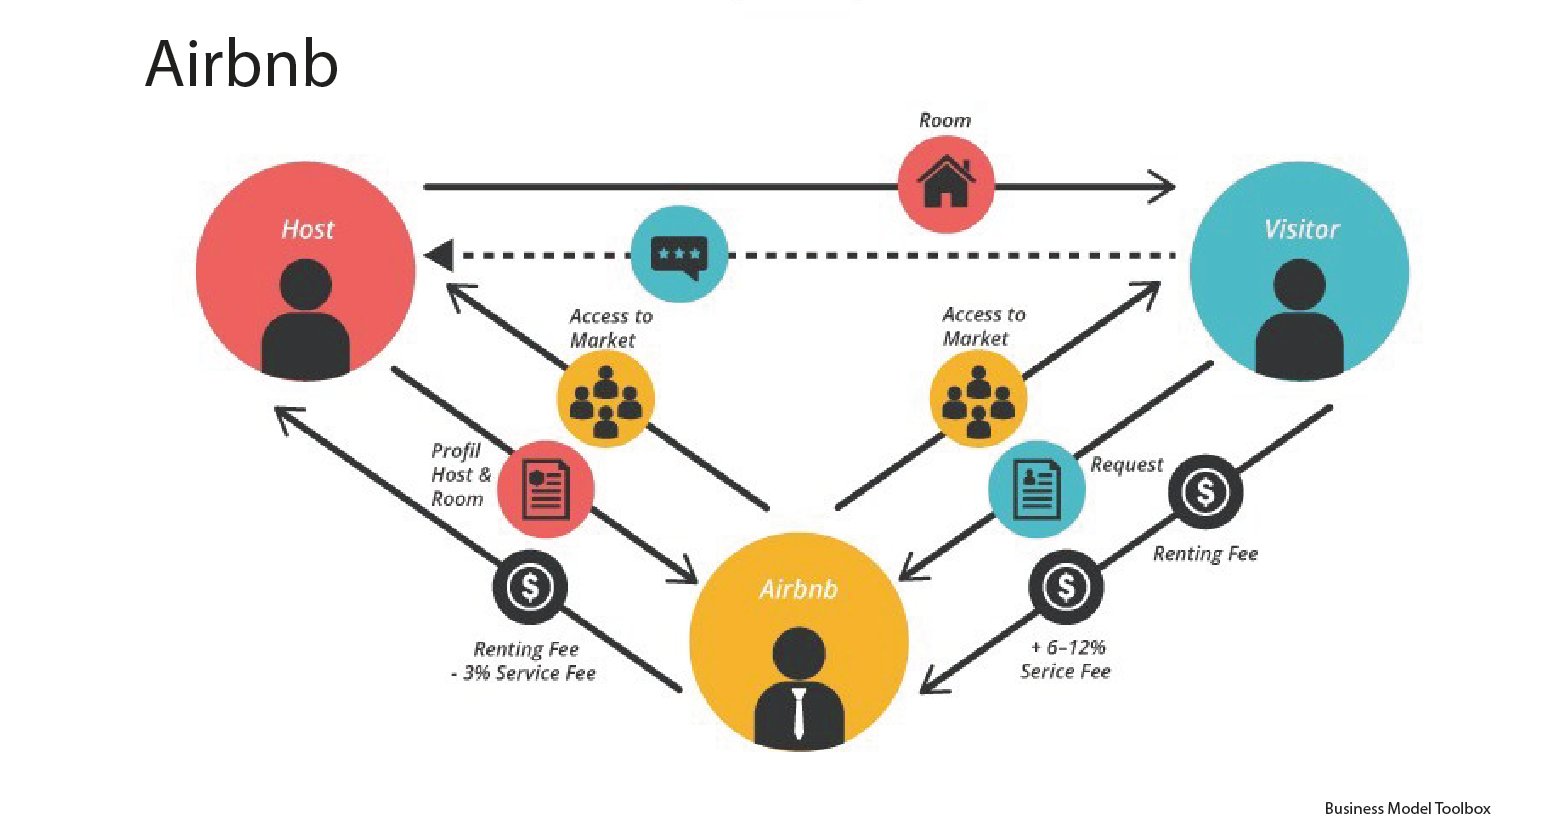
Business model graphics have been employed in financial communications for a long time. If you’re not currently using one to depict how you generate value, it’s a good time to start. The graphic usually includes the key components and functions of your business that generate revenue and drive profit.
BUSINESS PROCESSES, PROGRAMS, AND SYSTEMS
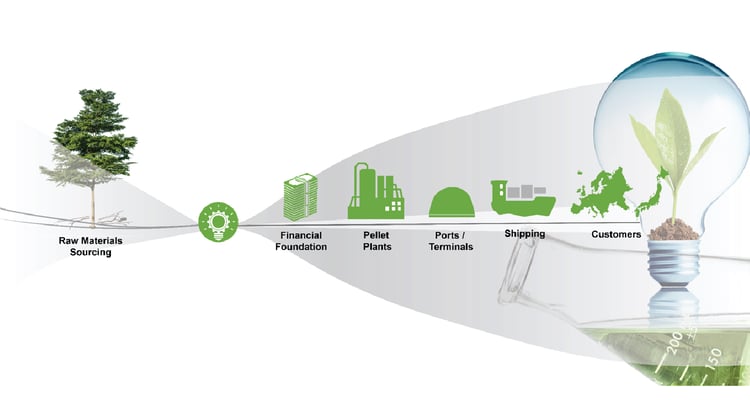
These differ from the business model in that they depict a component of the business, a function, activity or initiative.
CORPORATE INFOGRAPHICS
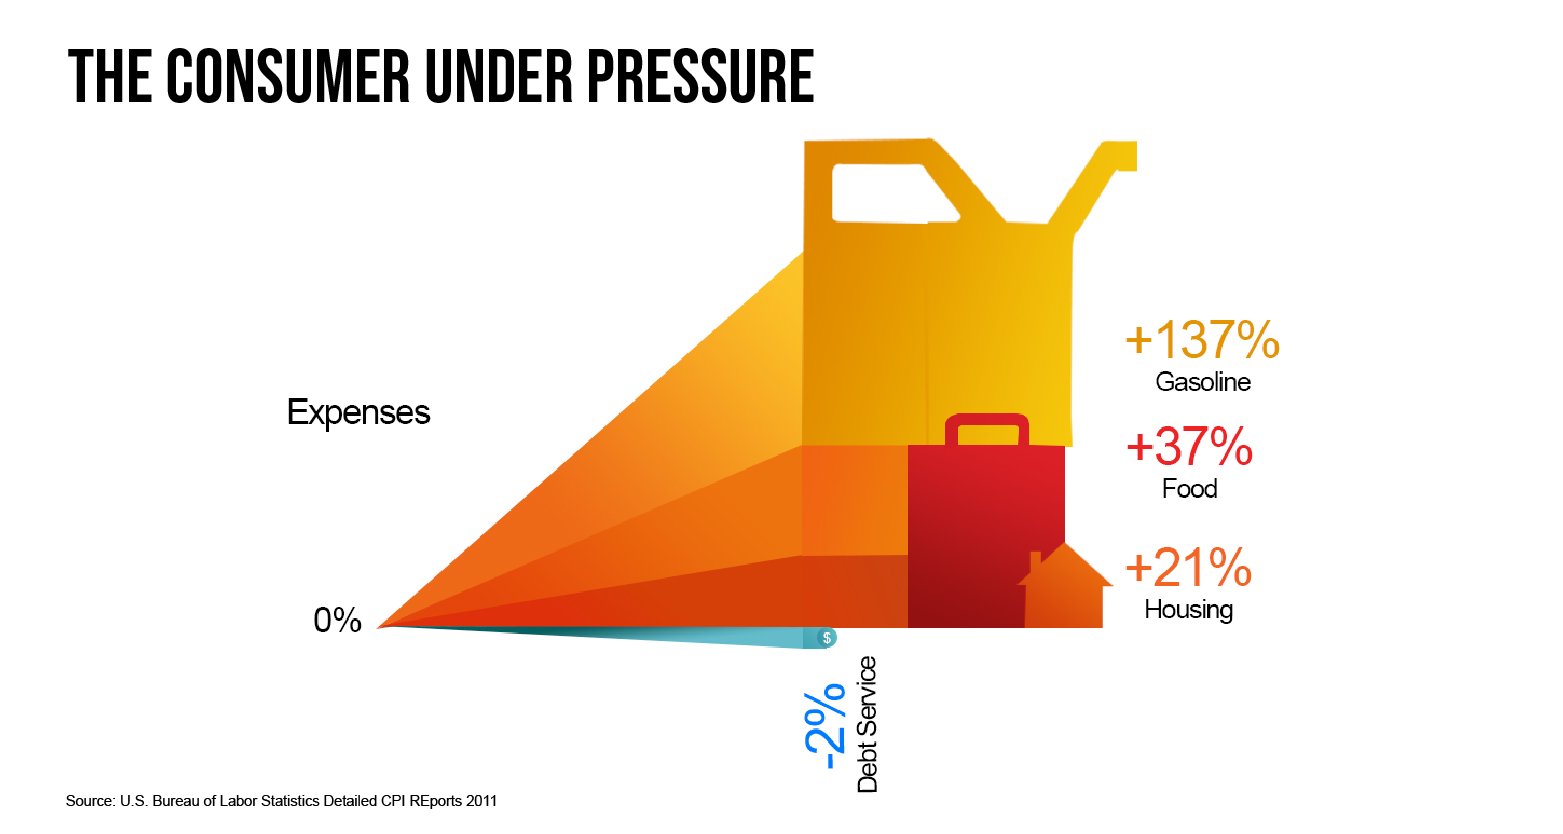
This is a broad category where we have seen the biggest increase in use. Companies regularly leverage infographics and icons to depict key stats on the company, KPI’s, market research, management effectiveness, and competitive landscape and consumer trend stories.
DATA VISUALIZATION
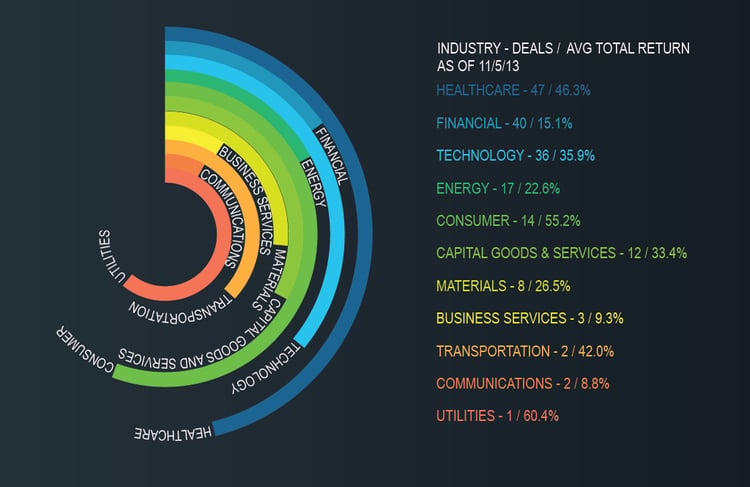
In this category we're referring to graphing data that is beyond the scope of Excel or PowerPoint. Nested pie charts and maps are just two examples.
TECHNOLOGY AND PRODUCT SOLUTION ILLUSTRATIONS
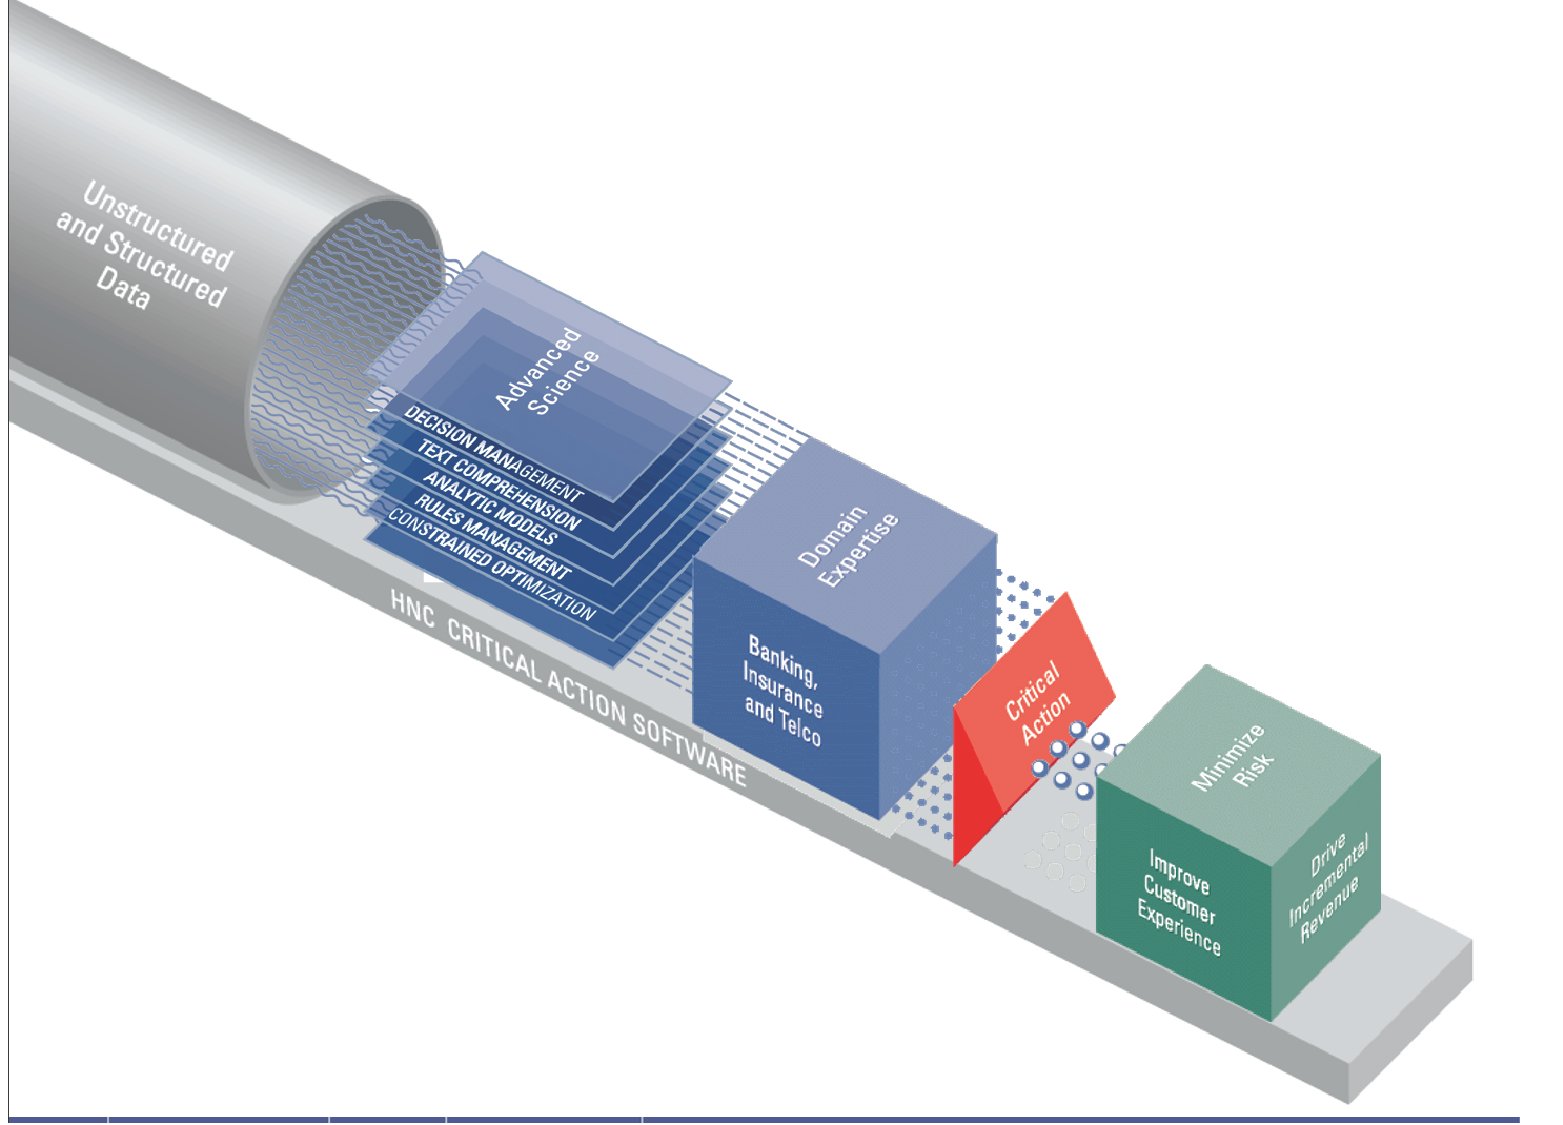
As the name implies, these depict technology such as data architectures and product offerings with customer benefits.
Creating effective infographics and data visualization for business audiences takes skill, creative talent and a lot of thought. Too commercial or too amateurish and you turn off business audiences. Too complex or off the mark and instead of speeding the conversation, you risk derailing it. Need help? Get in touch.


